
If you’ve done any reading on AI/ML you’ve probably heard someone say that the real challenge is collecting and organizing the data. That discussion is usually about finding good data, but I can tell you that it’s also a bit tricky to get data that you have access to organized enough for ML algorithms to run. This is especially true when you’re learning Python and Panda for the first time. Since this is just a learning experience for me, I cut myself off at about 10 hours of data gathering and sorting.
The big decision I had to make before creating the data is what should I make the “target” value. I could have either taken a direct path and asked the model to predict whether we should make a particular bet or I could take an indirect path and ask the model to predict what the score in the game would be and then derive whether the bet would be smart. I chose to take a direct path. I will explain this further below, but I have some data that relates to the actual bets and not the game. For example, I have data on how many people from my league have made a particular bet.
Another problem/issue with my data was that in order to create this “MVP” I used only 2021 data (data for previous seasons is harder for me to obtain since I delete most of the data out of LTHOI at the end of the season). This means that through week 16 I only have 208 data points. The SageMaker AutoPilot requires 500 data points. In order to solve this, I logged each game that I had three times. While this trick will let me process the data, it will make things like which two teams are playing a little bit too predictive.
As I am writing this the AI models are currently running, so I have no idea whether any of these have proven useful. Here are the data points I’ve given the model, how I gathered them, and what I’m hoping to get from them. When the model is done running, I should be able to add information about how actually predictive it is. I have also posted the Jupyter notebook that I used to gather the data to my git repo. In the notes below I tell you where in the code I gathered the data. At the bottom you can see the graph that AWS provides of how each field impacted the inferences both for over bets and bets on the home team.
- The teams that are playing in the game came with my base data. When you watch shows about gambling you’ll always here statistics like, “The Steelers have never failed to cover when more than 5 point underdogs.” I am highly skeptical that individual teams help predict outcomes of games independent of their statistics. However, with the duplicative data I expect this to end up being a key indicator.
- Source: This comes with the base data about the games from mysportsfeeds.com
- Section of Jupyter Playbook: 3, 4, 5
- Actual Impact: Because
- Which team is the home team. Since I have the data in front of me, I can tell you that on average home teams win by 1.2 points this season. I assume that will play in to the model in some way. I could also see with the previous data point that certain home teams have a bigger advantage than others.
- Source: This comes with the base data about the games from mysportsfeeds.com. There is also a field that contains information about whether the home team is actually playing at their home field. For example when the NFL played a game in London. Technically there was a “home” team, but the venue did not have allegiance to the home team.
- Section of Jupyter Playbook: 3, 4, 5
- Actual Impact:
- The line and over/under line that I used in LTHOI.com. These are produced by the oddsmakers and are designed to make the game 50/50. The line is in terms of the home team, for example if the home team is favored by 8 points I will have an 8, if they are 8 point underdogs I will have a negative 8. The lines continue to shift over time, but in order to make LTHOI.com less confusing, I freeze the lines at midnight the night before the game. I doubt this will have much impact on the outcome, but I could imagine that sometimes bookmakers have tendencies that could be exploited.
- Source: This is retrieved from the database of my LTHOI game. I used the boto3 SDK to access that database and pull the information.
- Section of the Jupyter Playbook: 5
- Actual Impact:
- The average points scored and points against for each team. I calculate this by cycling through each team’s previous games and adding them up. There might have been some fancy data science way to get these together by combining spreadsheets, but I’m still more of a developer than a data scientist!
- Source: This data was pulled from the mysportsfeeds.com statistics API.
- Section of the Jupyter Playbook: 6
- Actual Impact:
- The number of people in my league who made each type of bet (over, under, home team, away team). I am thinking there may be something interesting here in the wisdom of crowds. Also, if there is news or injuries that the model doesn’t capture this will capture part of it.
- Source: This data is available from the LTHOI table on bets. Unfortunately, I use a dynamodb and a very flat database so there’s a lot of expensive querying in here. If I keep using this AI model, I may have to add an index that will allow me to query this more cheaply.
- Section of the Jupyter Playbook: 7
- Actual Impact:
- The final line for the game at kickoff. Since LTHOI.com freezes the line at midnight before the game starts, there are sometimes factors that cause the line to move significantly (a player is injured or sentiment shifts). Some of the people in my league like to focus on this and others like to ignore it. We’ll let the artificial intelligence decide whether it is important.
- Source: This data is available from the ODDS feed of mysportsfeeds.
- Section of the Jupyter Playbook: 8
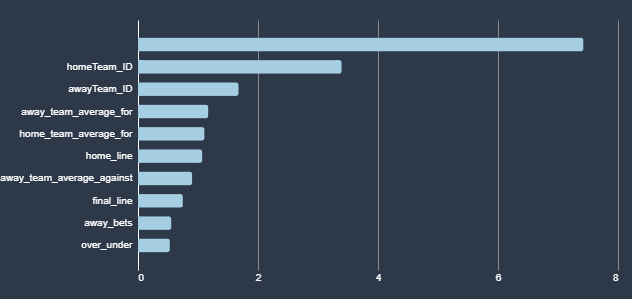
How each feature influenced a bet on the Over. 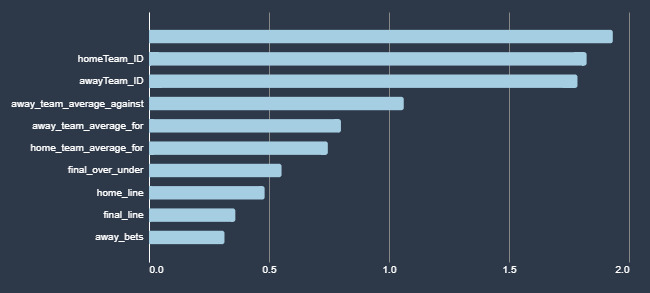
How each feature influenced a bet on the Home Team against the spread.
After creating this data, I used a separate Jupyter notebook to create the actual training data. It’s not as exciting as choosing which data to use, but you can find it on my github here. I decided to make the AI have four separate models that will make a binary choice on each bet. My intention is then to interpret the results and only place a bet if the models agree.